Results
In this section, the results and discussions of the experiments will be elaborated
In this section, the results and discussions of the experiments will be elaborated
The objective of this section is to decide the perfect condition for monomer annealing. There are different aspects to annealing the perfect monomer: MgCl2 concentration, temperature, and annealing time.
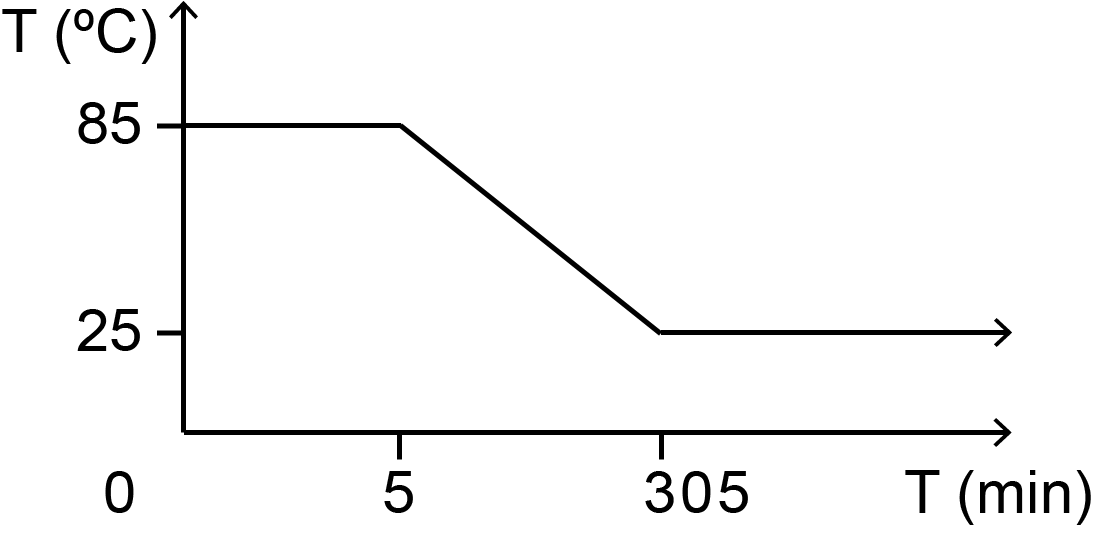
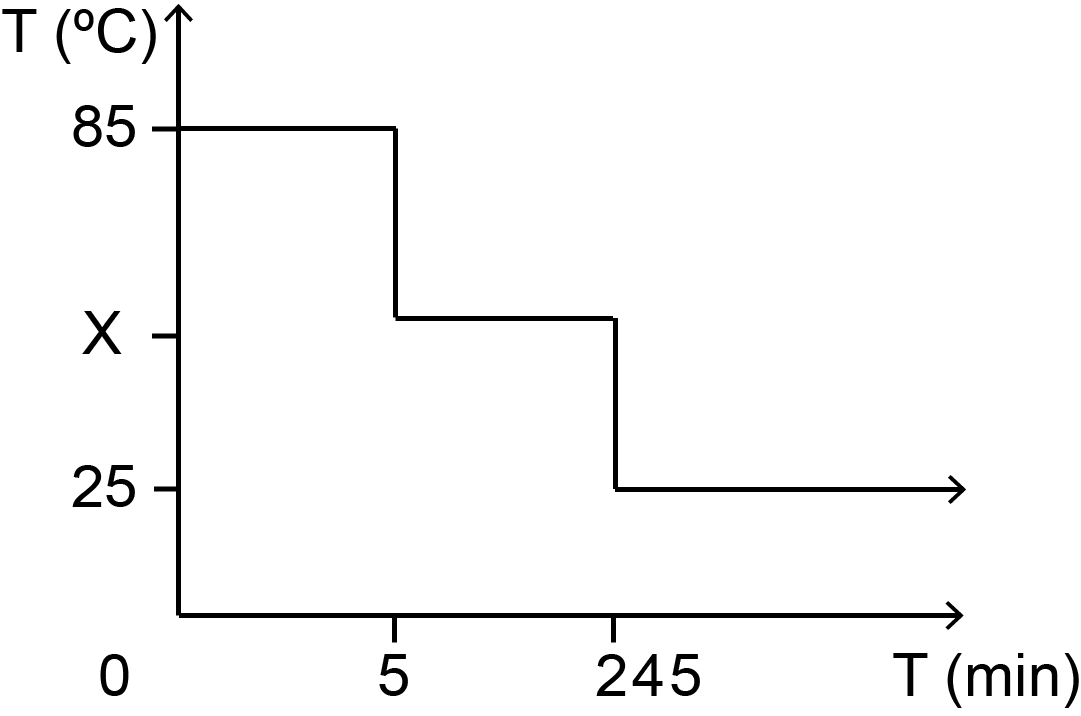
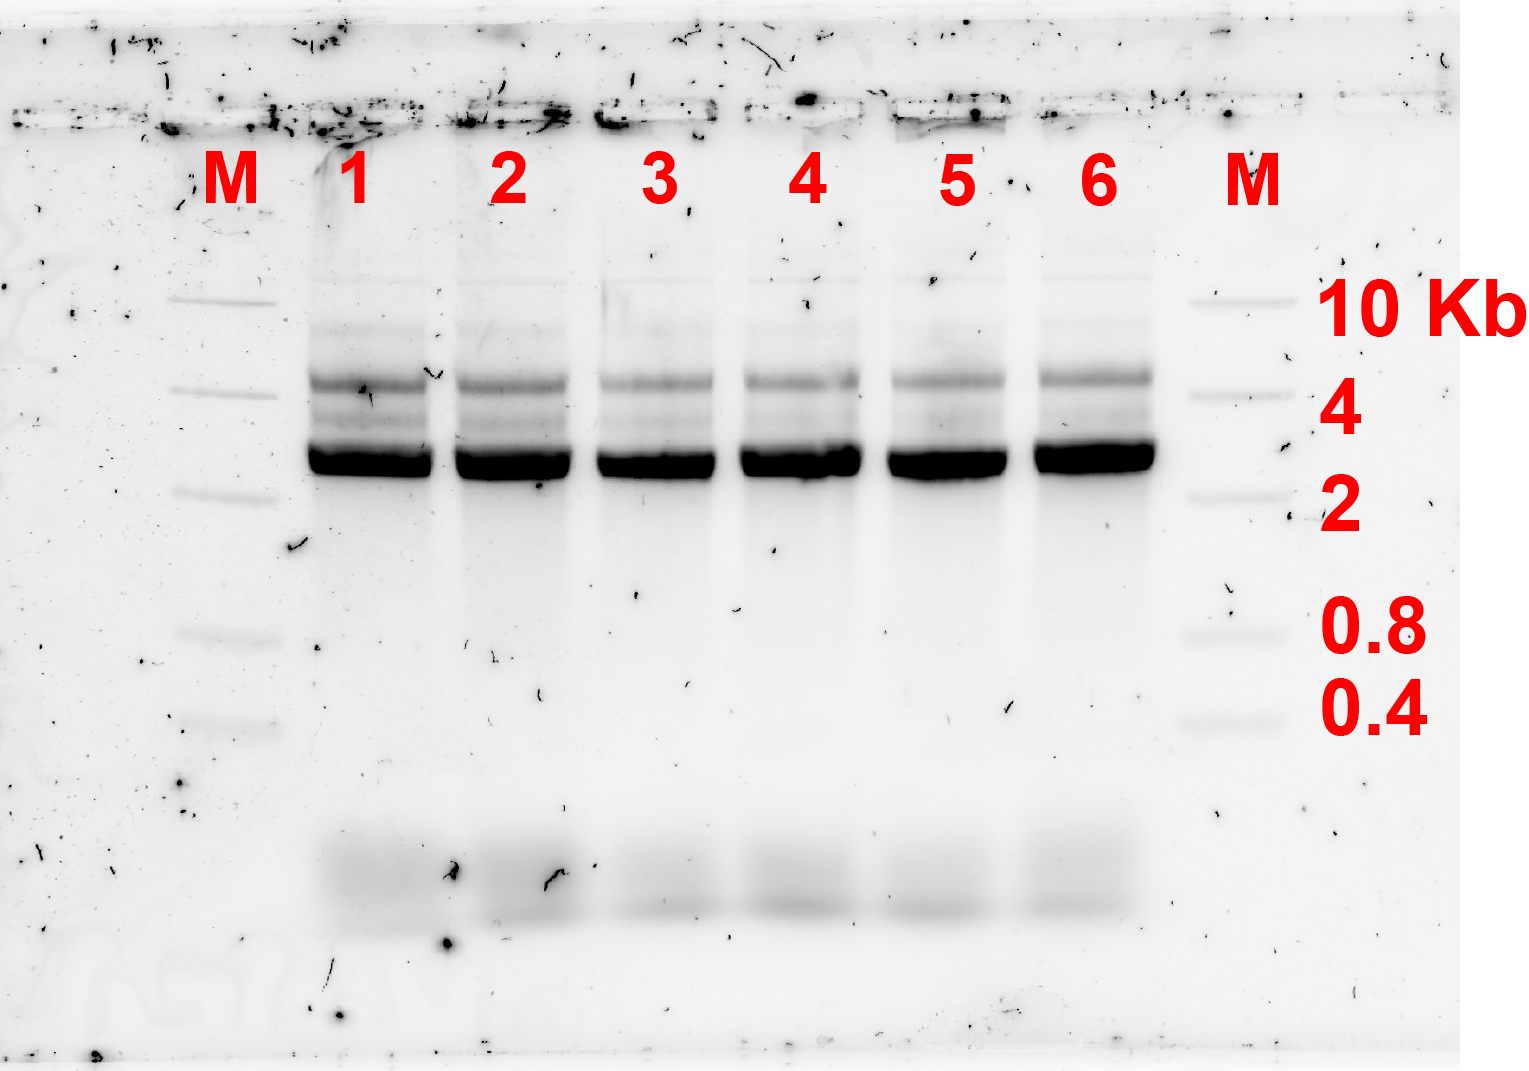
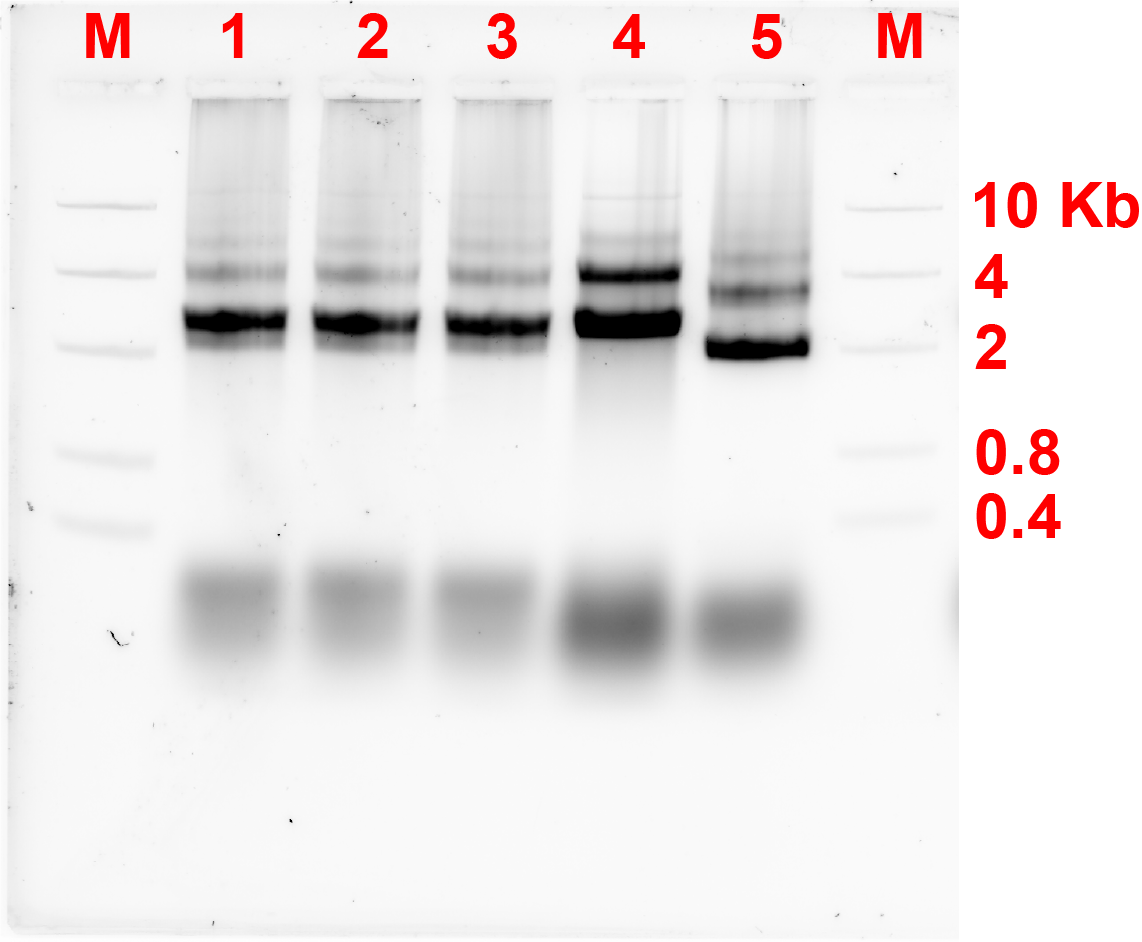
For this part, it did not take a lot of trials to find the perfect annealing condition as the design is 2D and has been well documented. The temperature gradient used in annealing is as seen in fig 1.1 while the gel electrophoresis result of the different MgCl2 concentrations can be seen on fig 1.2.
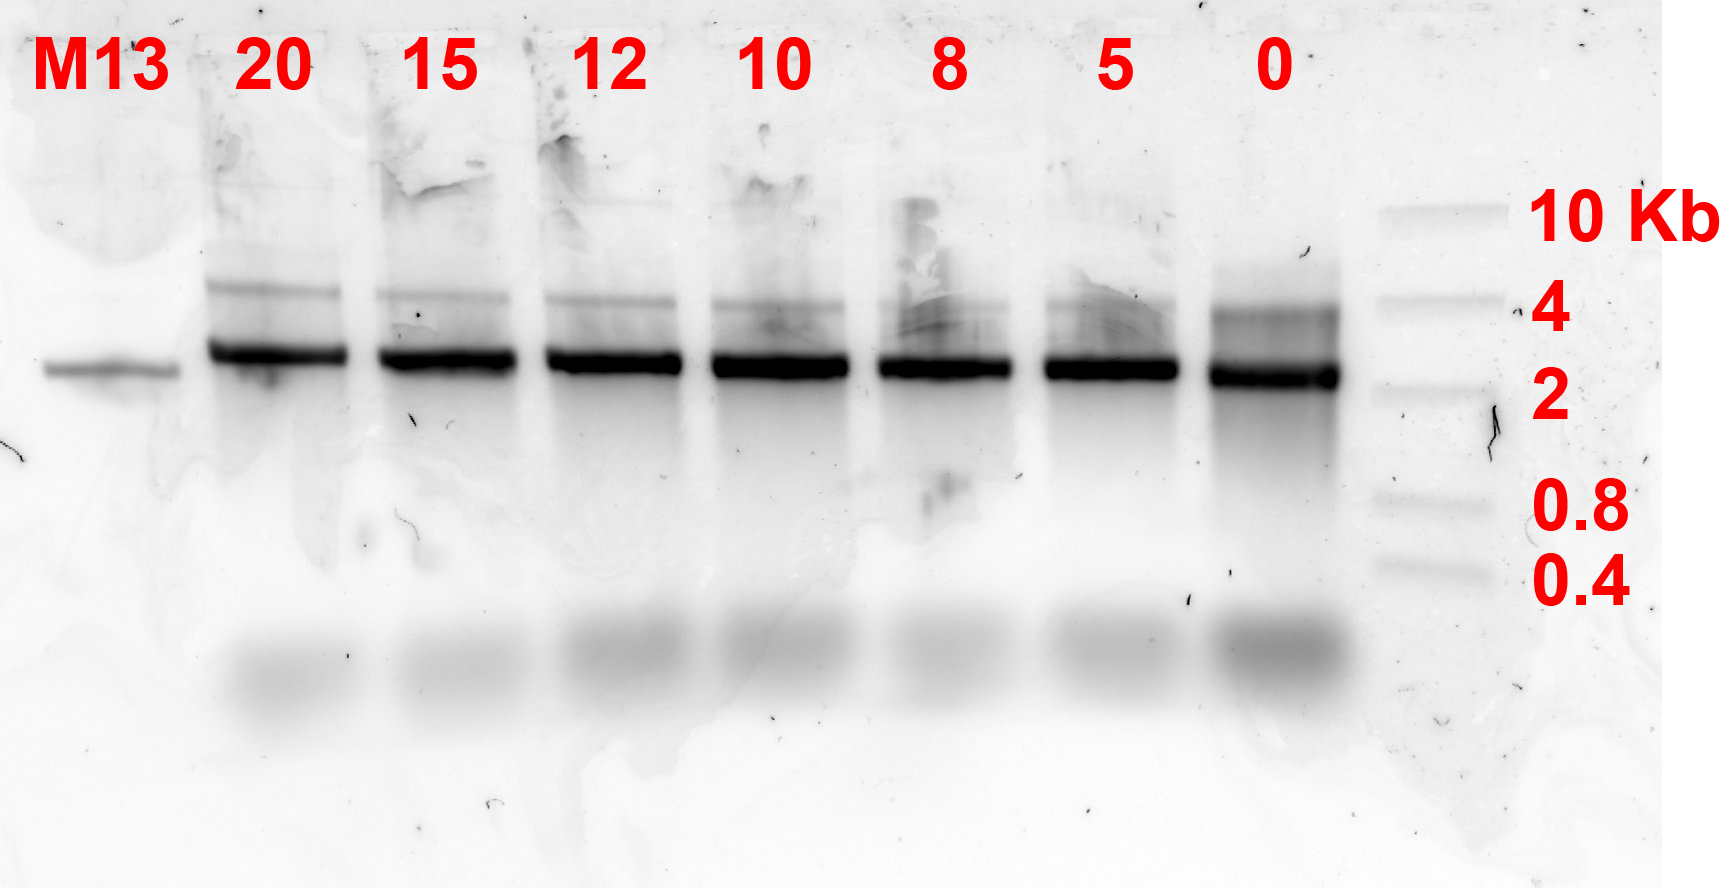
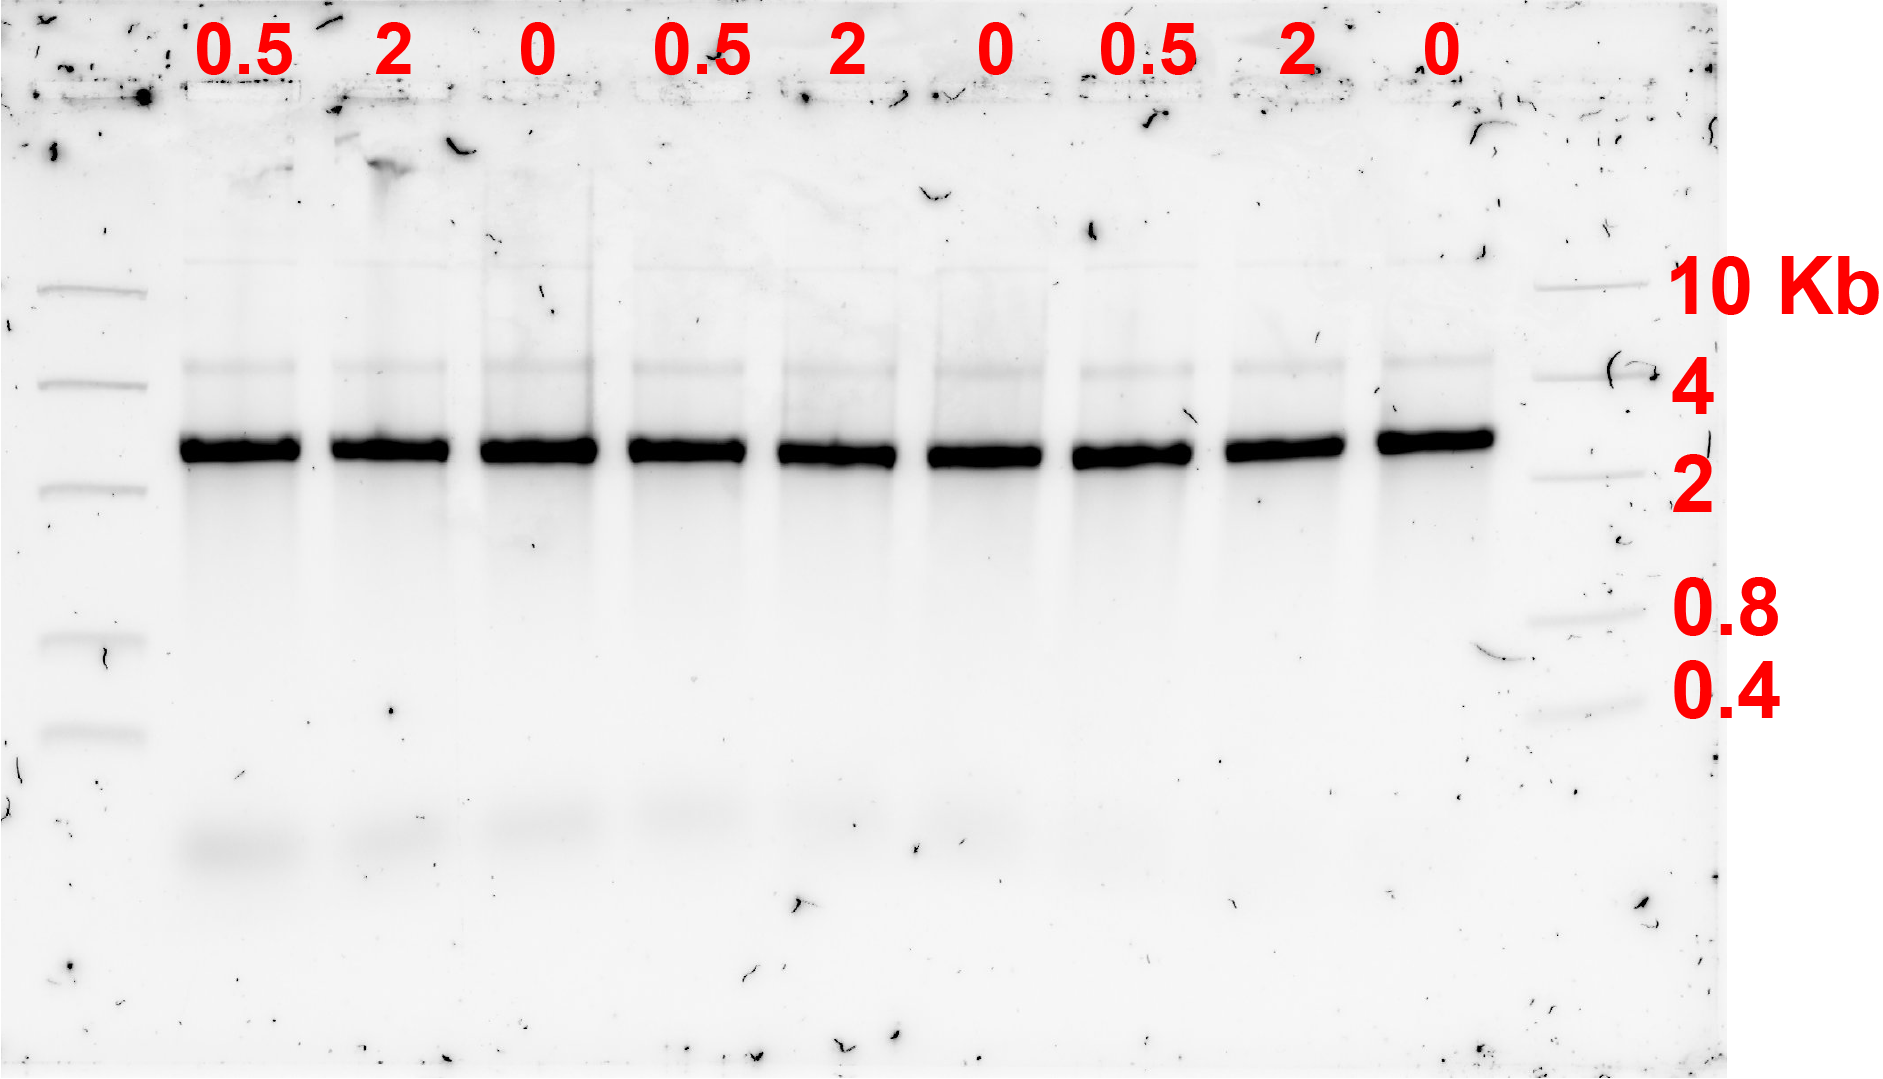
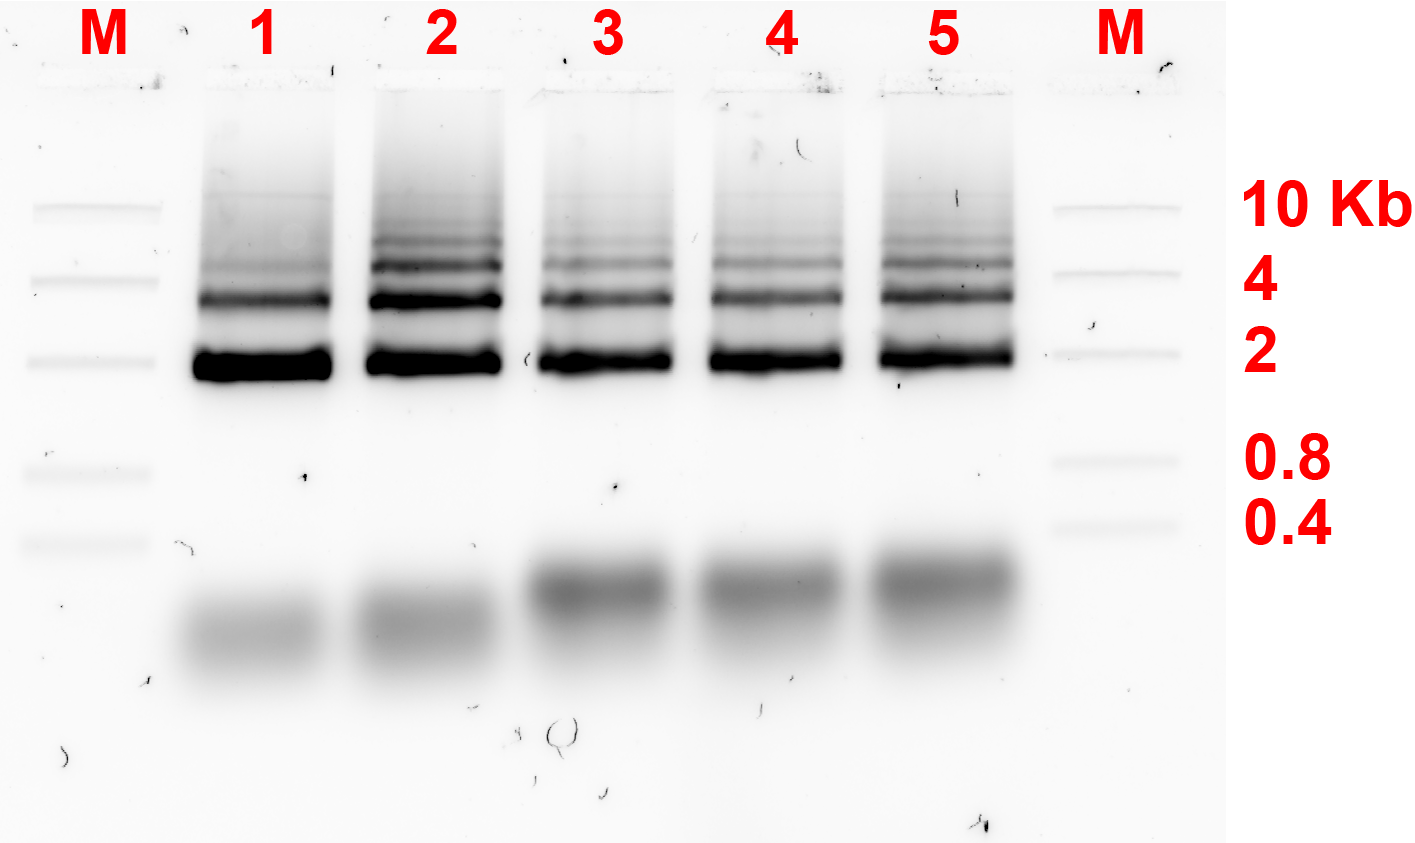
Alhough fig 1.2. did not show the differences between concentrations really well, intensity analysis using imageJ showed the most concentrated bands by density are the ones at 10 and 12 mM MgCl2 concentrations. The structure is an equivalent of about 5700 BP dsDNA, however it can be seen that the upper less darker band is at around 4 kb. This might have been influenced by the structure shape, which causes the flow through the gel to be different than predicted. Furthermore, the 2 bands in the lanes might also be caused by the monomers taking different conformations.
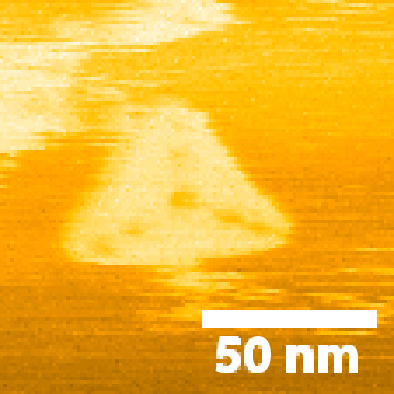
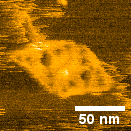
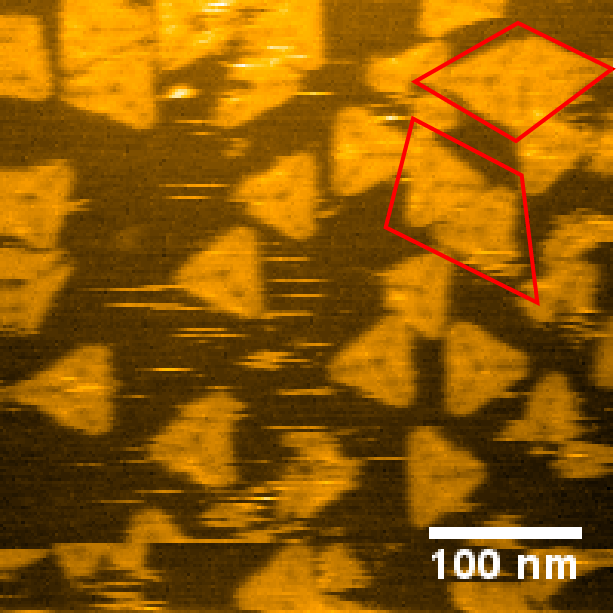
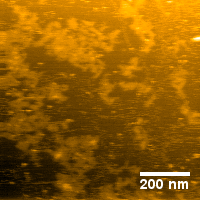
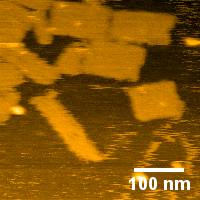
AFM observation showed that the annealing produced proper monomers as predicted as seen in fig 1.3a and 1.3b.
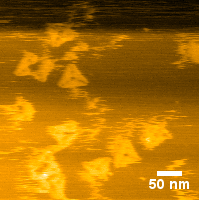
Even though gel electrophoresis result showed 2 bands that might mean that the monomers are taking different conformations that can influence the rate of flow through the agarose gel, AFM observation showed that the monomers are folded properly and that the conformations might be negligible.

After successful of monomer annealing, we moved to the next target: establishing the connection between the monomers.
Firstly, the first connection design is based on toe-hold method: replacing monomer’s existing staple strands to the ones that are more thermodynamically stable.
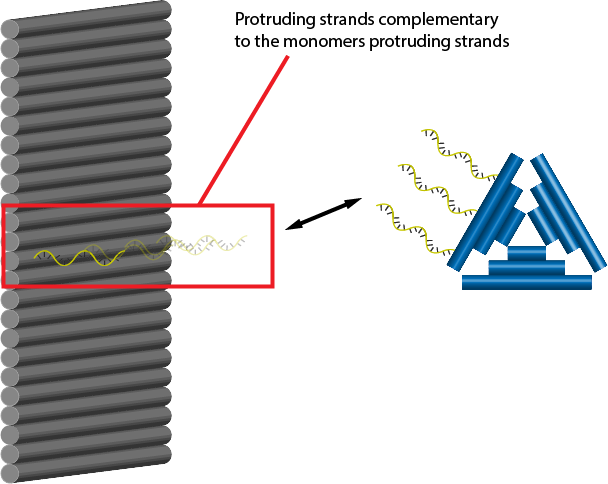
Second, we tried complementary strands methods: protruding staple strands that have weak secondary structures and can make stable connection with the counter partners.
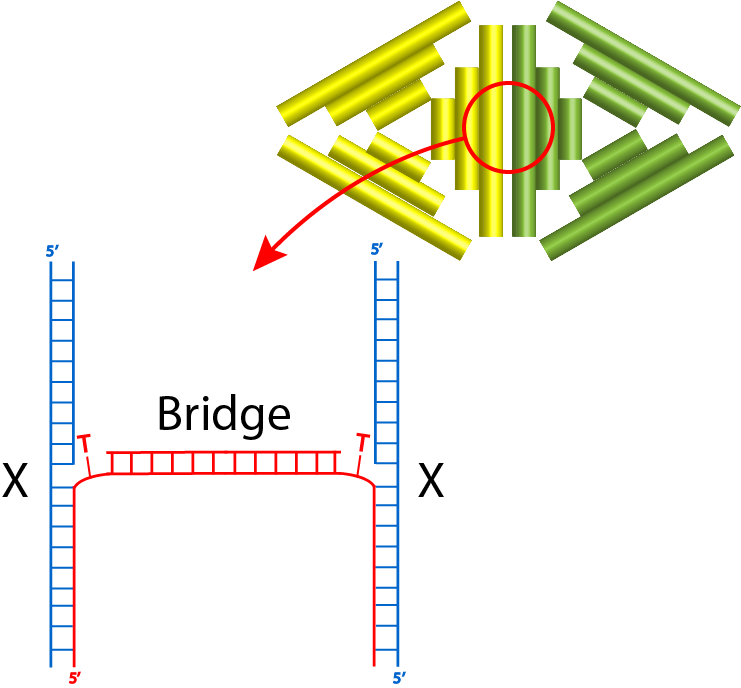
Third, we tried the bridge method: protruding strands that are not complementary, but can be connected by the bridge strands.
For the first connection design, the bridge strands were added at a ratio of monomer:bridge 2:1. These strands were added, and the monomers were incubated at a certain constant temperature for 4 hours. Fig 2.1. and fig 2.2. show the results of annealing at MgCl2 concentration of 10 and 12 MgCl2 concentration respectively.
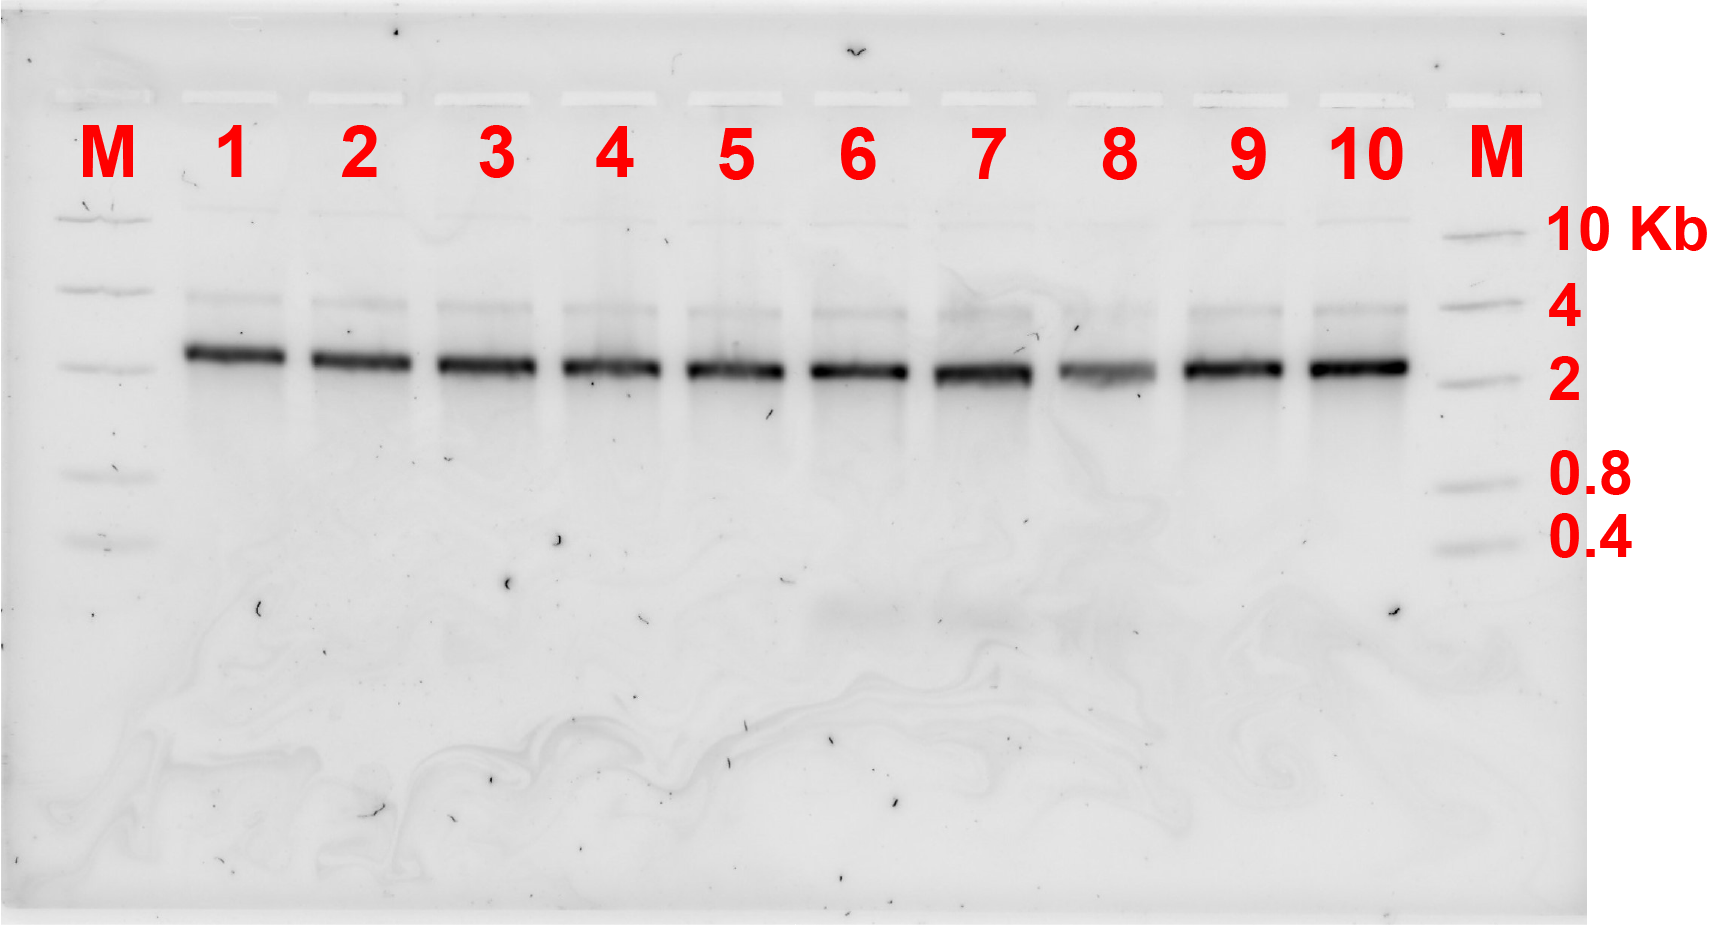
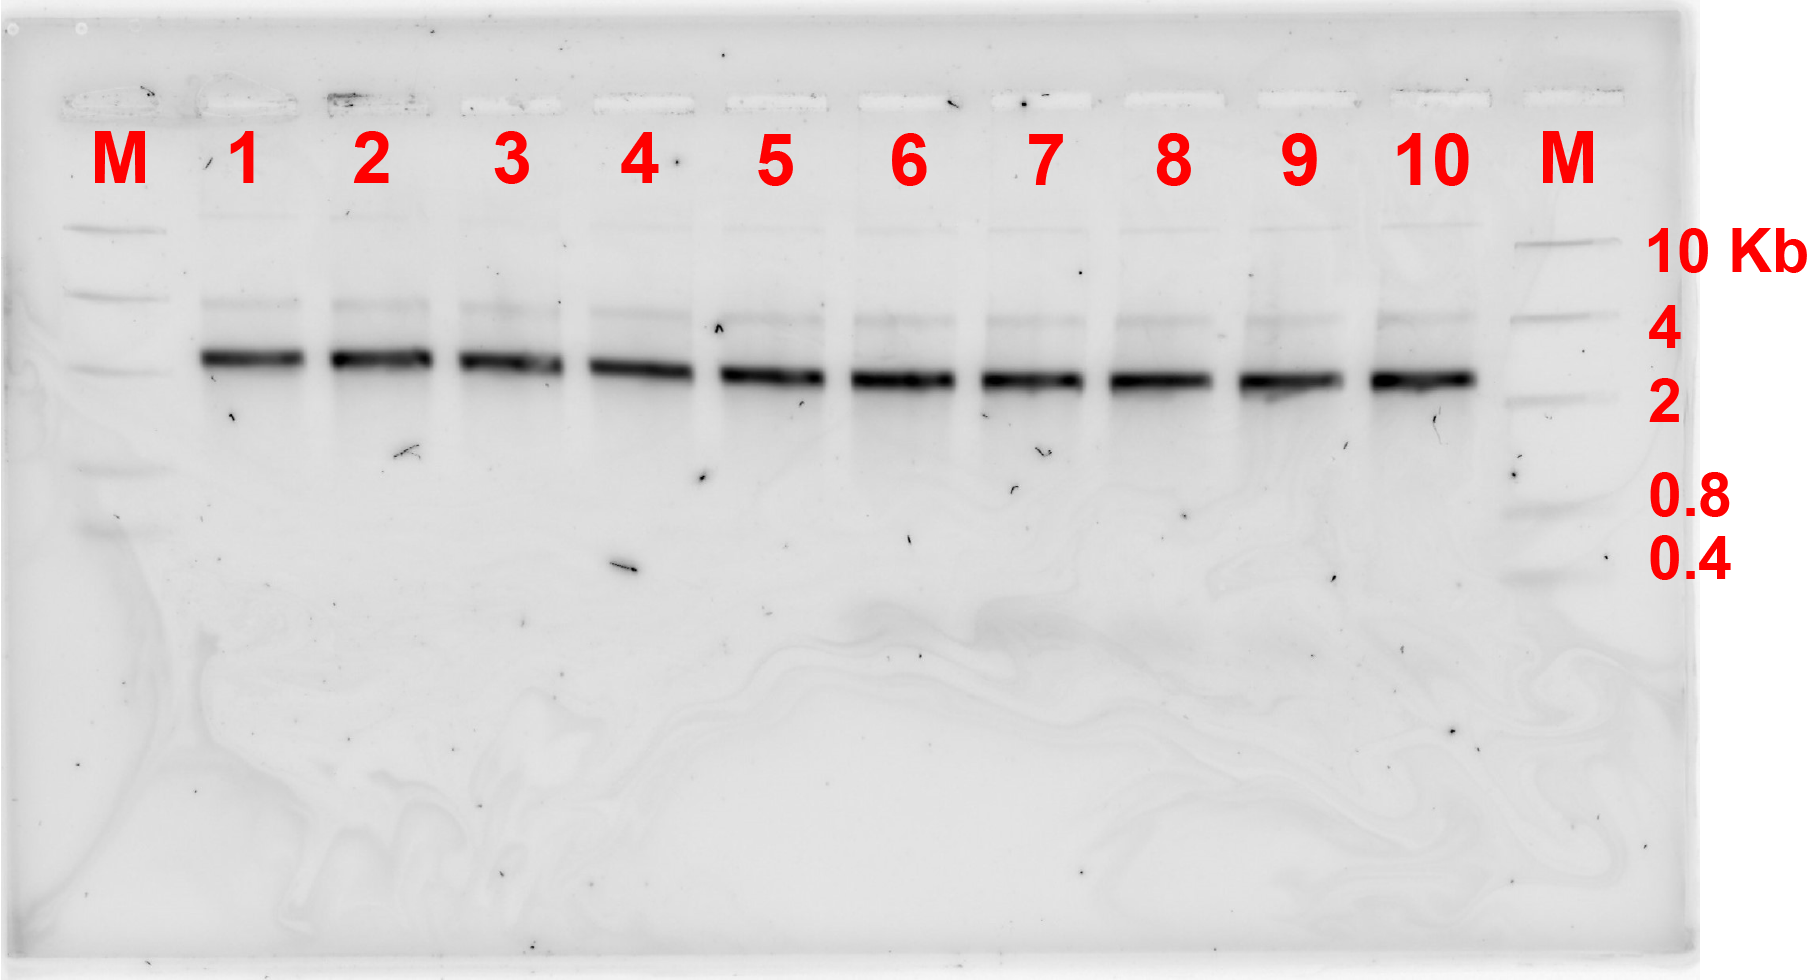
Unfortunately, after 4 hours of incubation, the bridge did not form connection between the monomers as there was not any band showing the formation of dimers referring to fig 2.1 and 2.2.
As the previous experiment failed to show the formation of dimers, concentration of the replacement strands or bridges were adjusted. Previously, the ratio of monomer:bridge was 2:1, now the ratio was changed to 2:1 and 1:5 and the gel electrophoresis results are shown in fig 3.1. and 3.2. respectively.
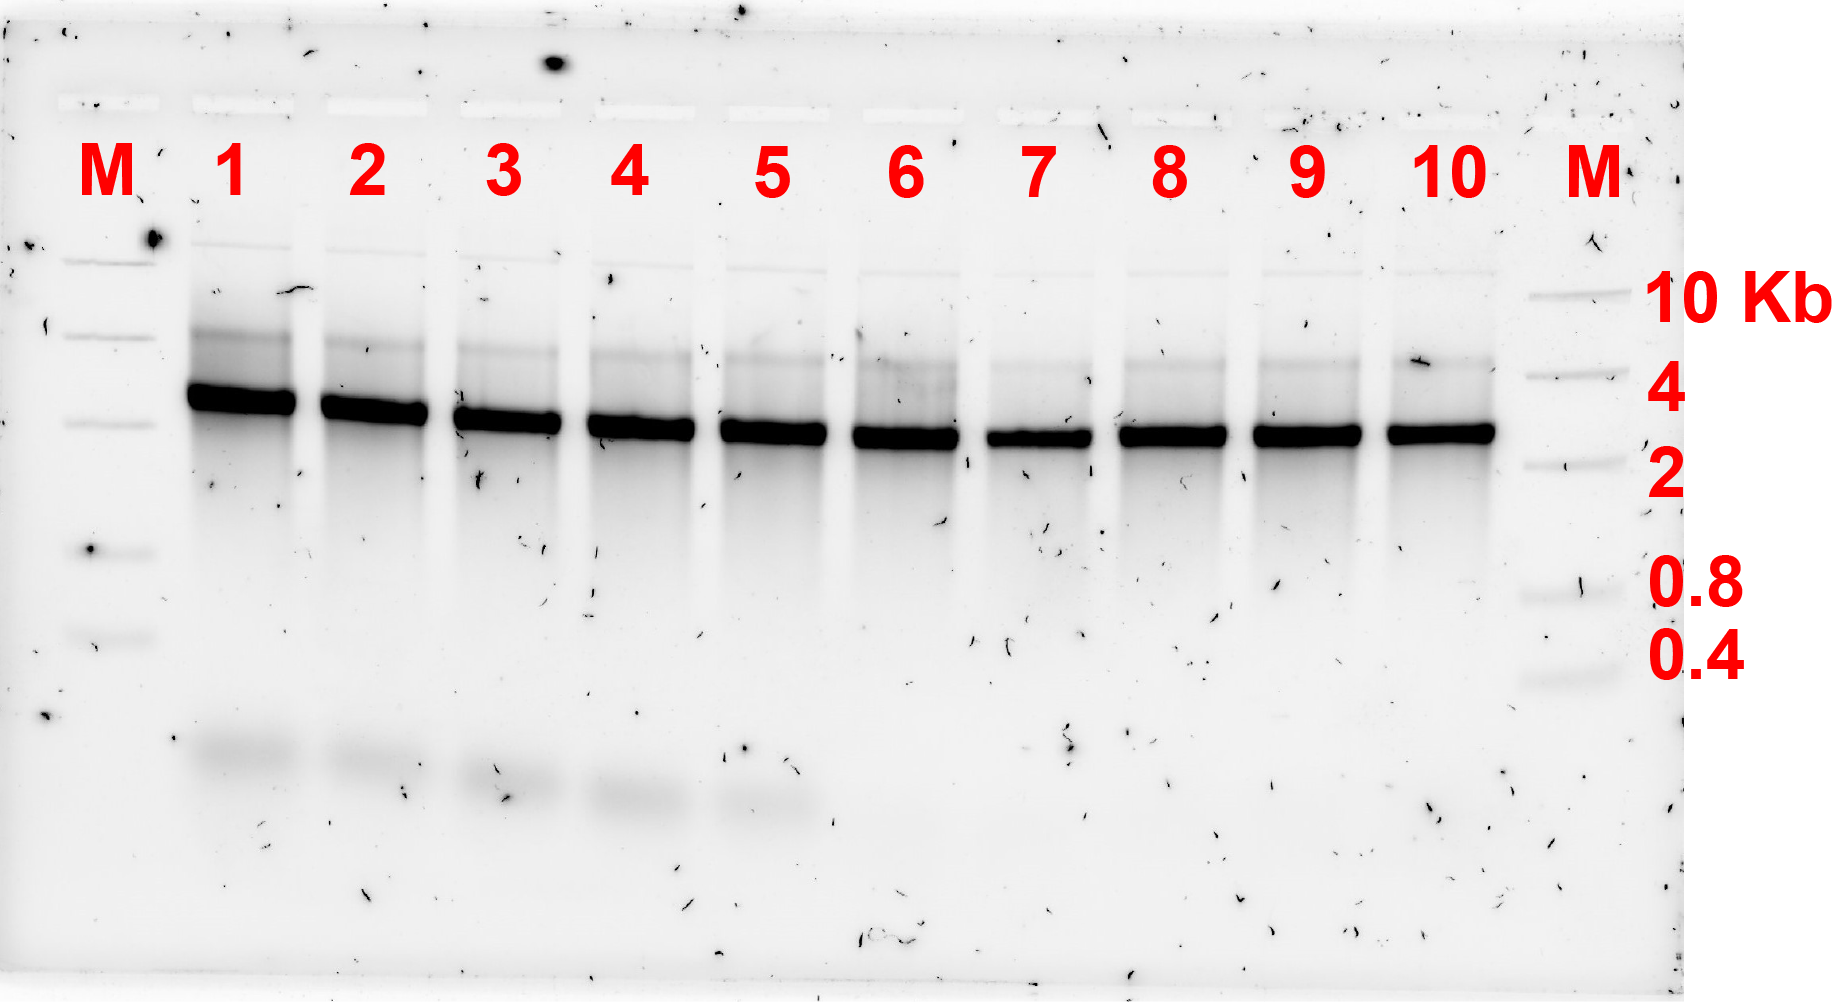
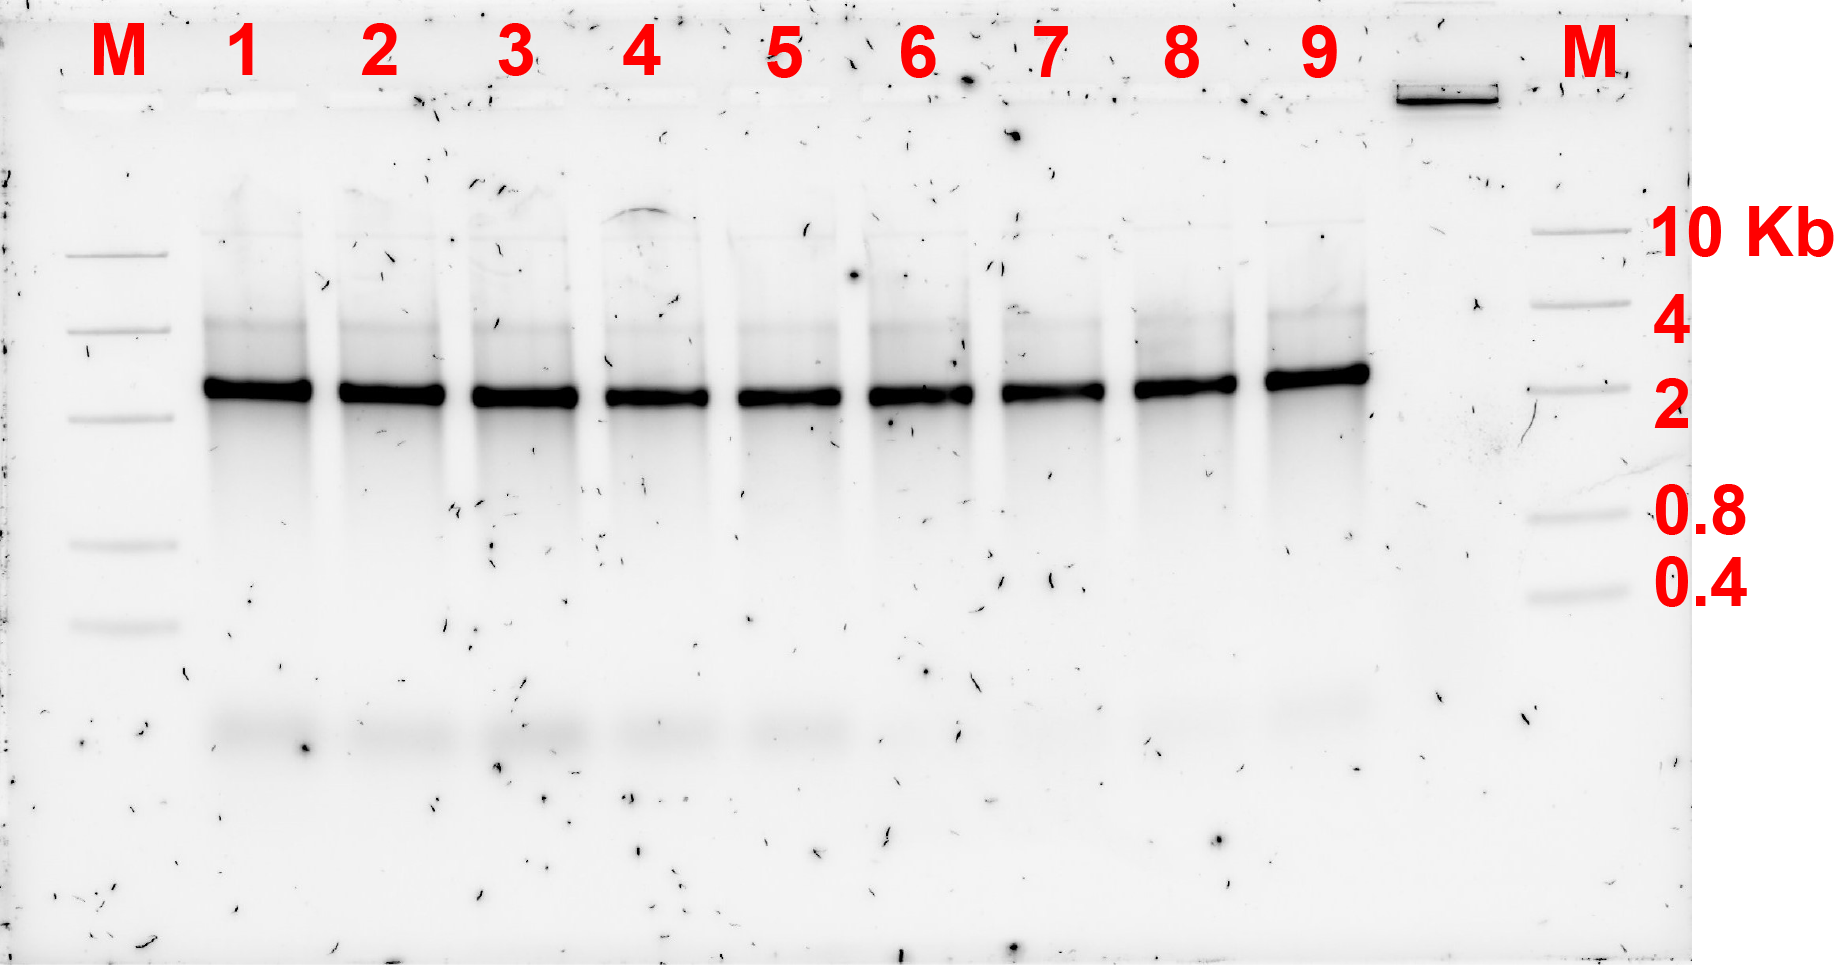
The gel electrophoresis result showed that the dimers were not formed.
After changing the incubation condition and failing to form dimers. We tried changing the condition of annealing of the monomers in case that the monomers might not have annealed properly and leading to the failure of formation of dimers. Therefore, we changed the annealing temperature of the monomer as described in fig 4.1. The resulting gel electrophoresis is available on fig 4.2.
The result did not change compared to annealing using the previous condition. Therefore, it can be concluded that the problem is not the annealing of the monomers.
As it was assumed that the monomers annealed properly, a final incubation incubation temperature change under different bridge concentrations was attempted. Results are as shown in fig 5.1.
AFM observation showed some monomers possibly forming dimers at a very low efficiency. Therefore, it can be concluded that the connection is unsufficient for this project.
After the different treatments, the connection did not appear to form. Therefore, it can be concluded that this connection design is not strong enough or that this connection design is not feasible to assist the swarming effect of the monomers.
In this section, the 2 different monomers with complementary protruding strands will be named monomer An and Bn where n indicates the number of spacers. The annealing condition for this section uses the annealing condition previously decided. The first experiment utilizes the protruding strands with 3T spacers and the result of gel electrophoresis available on fig 6.2.
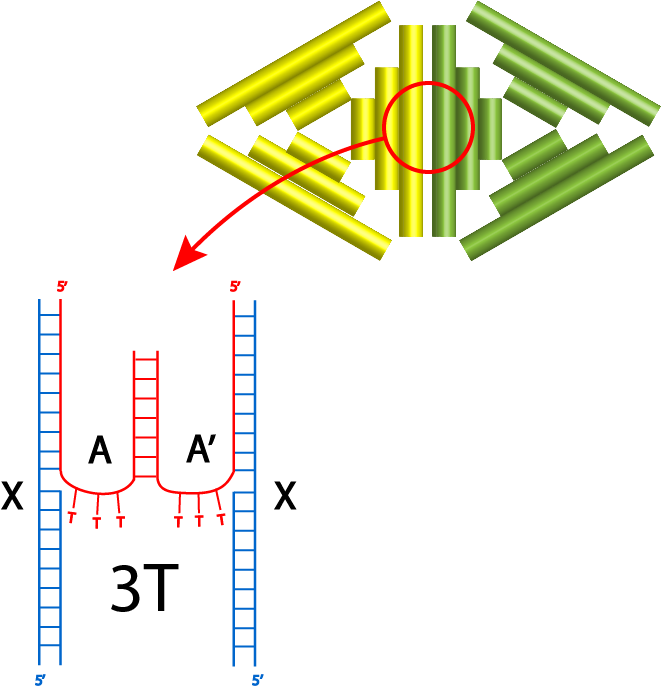
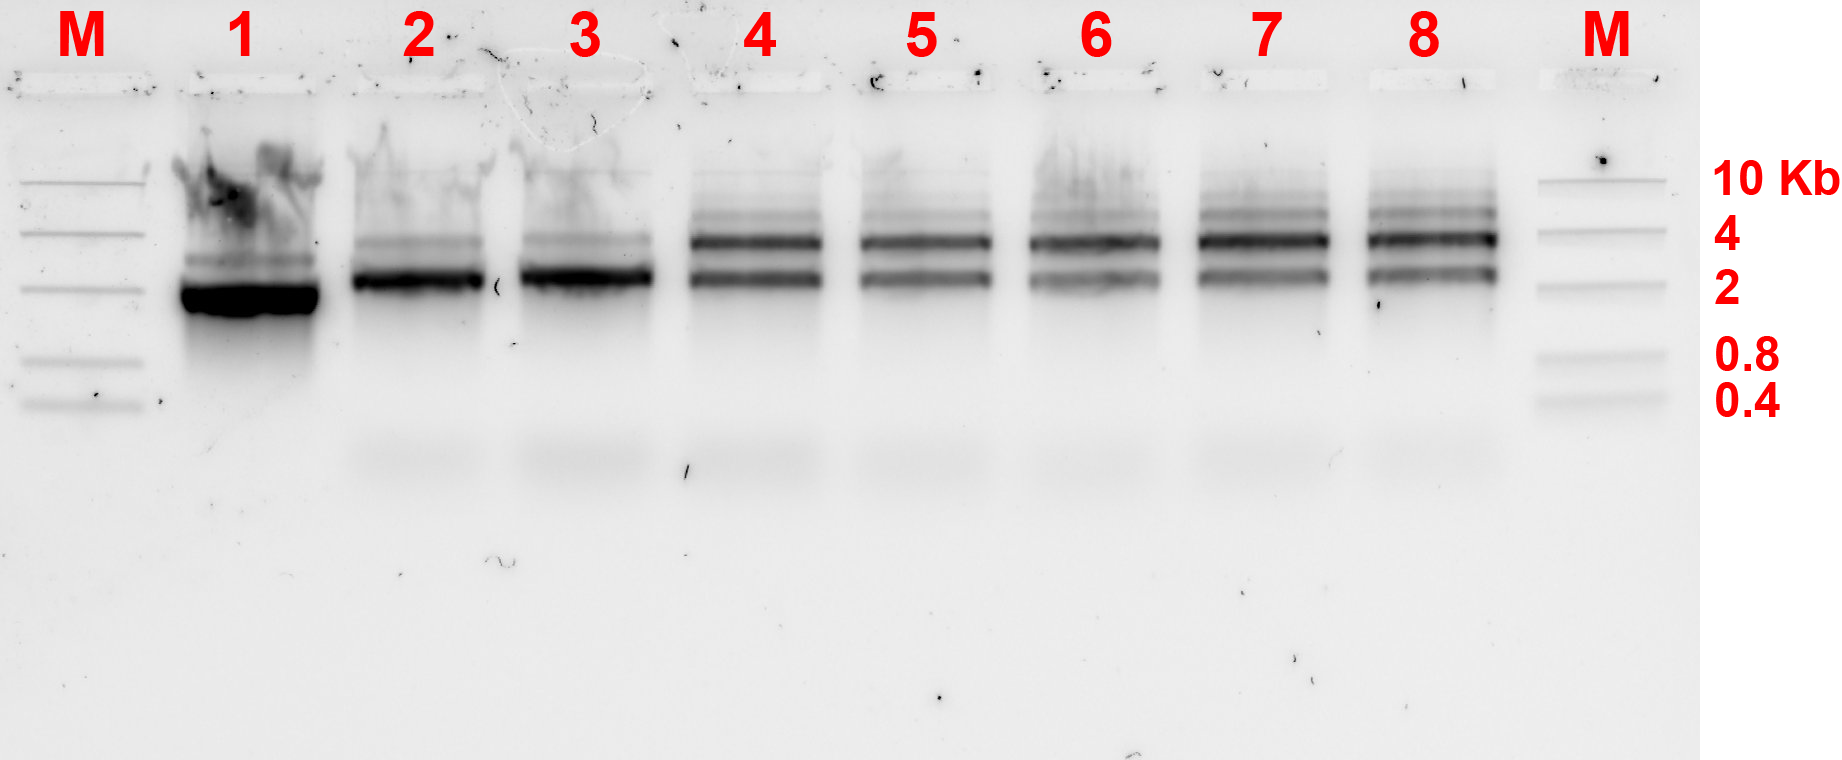
By comparing lanes 2 and 3 with lanes 4 to 8, the dimers might have formed as there are darker bands above the monomer bands shown by 2 and 3, however there are ambiguous multiple bands and AFM was needed to confirm the existence of dimers. 29.37°C incubation temperature seemed to be the most appropriate temperature for the joining of monomers.
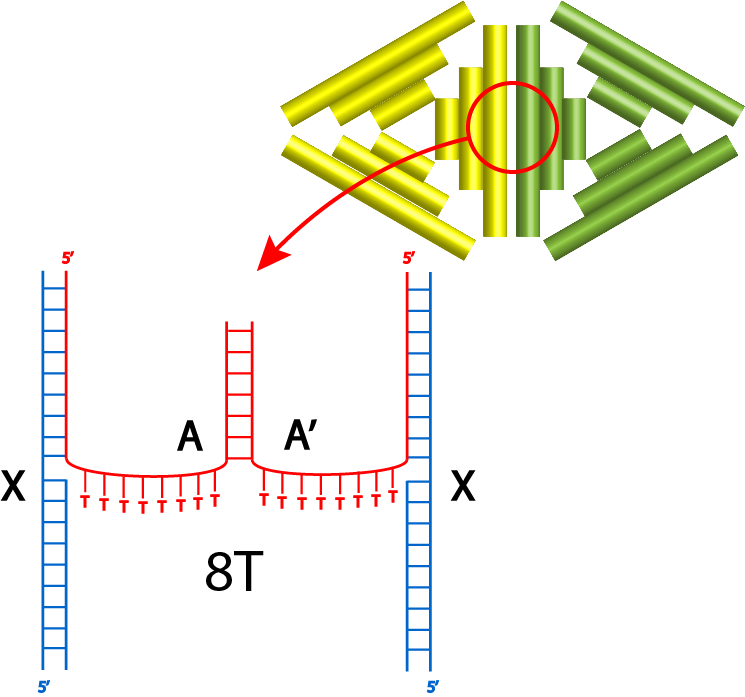
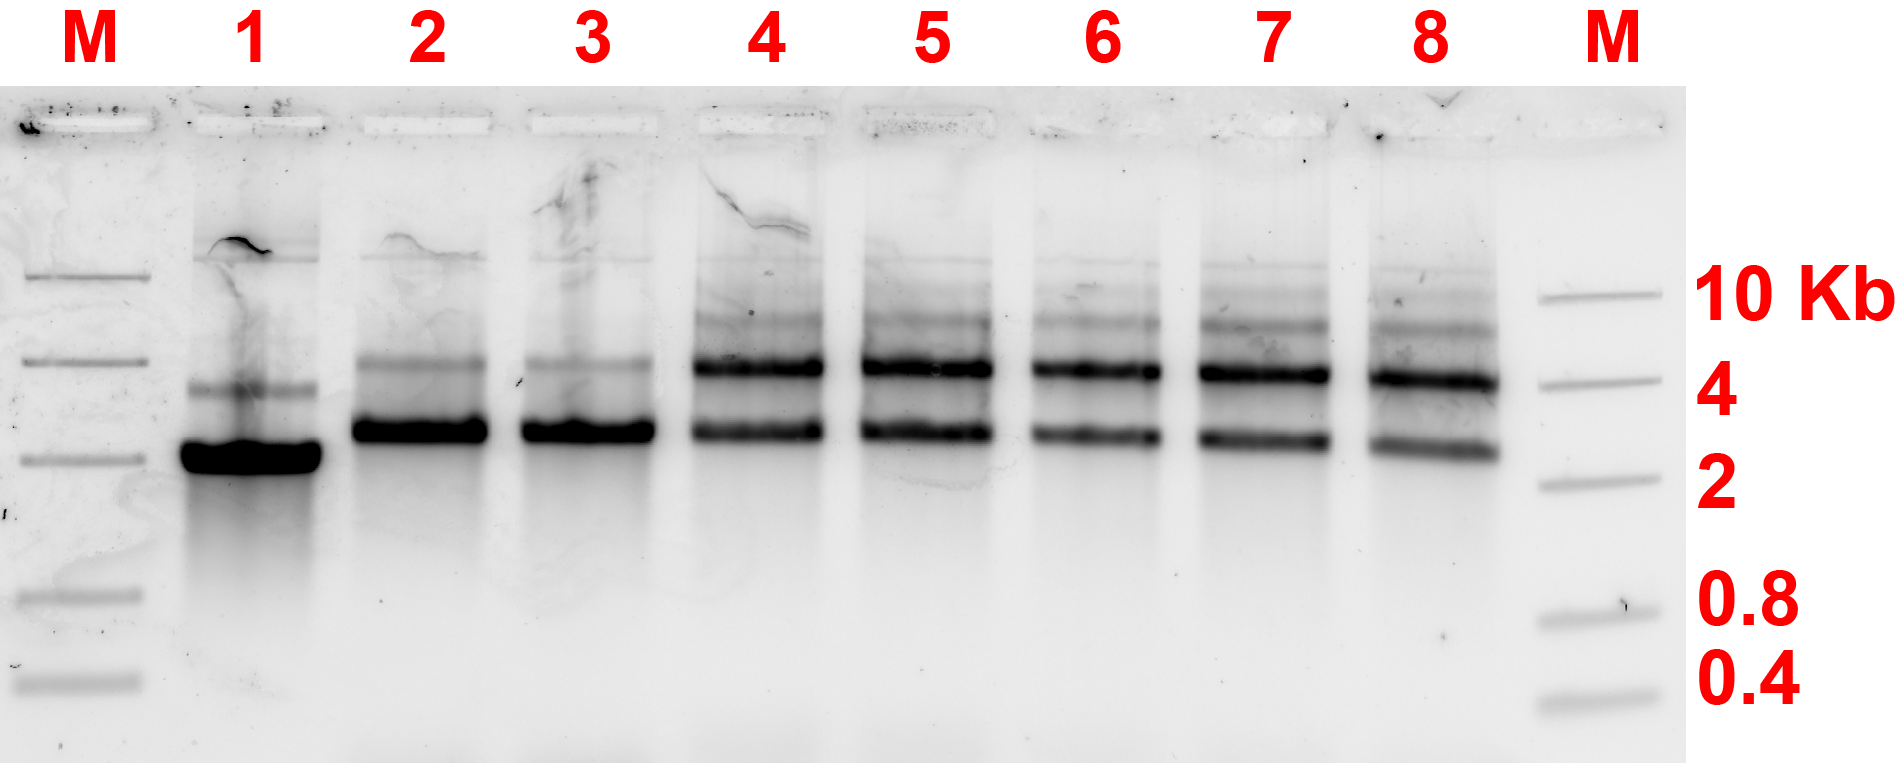
After the experiment for 3T spacer, 8T spacer experiment was also performed. The annealing and incubation conditions are unchanged. Results are shown in fig 6.4a and b.
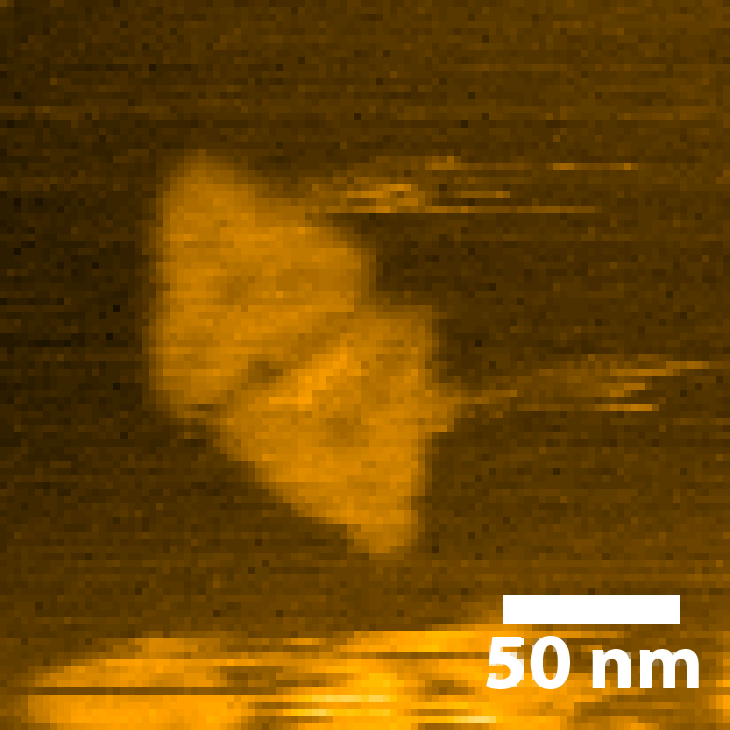
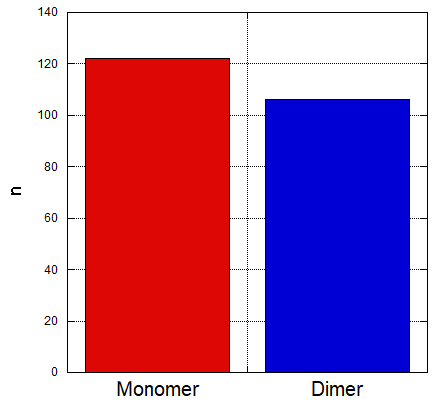
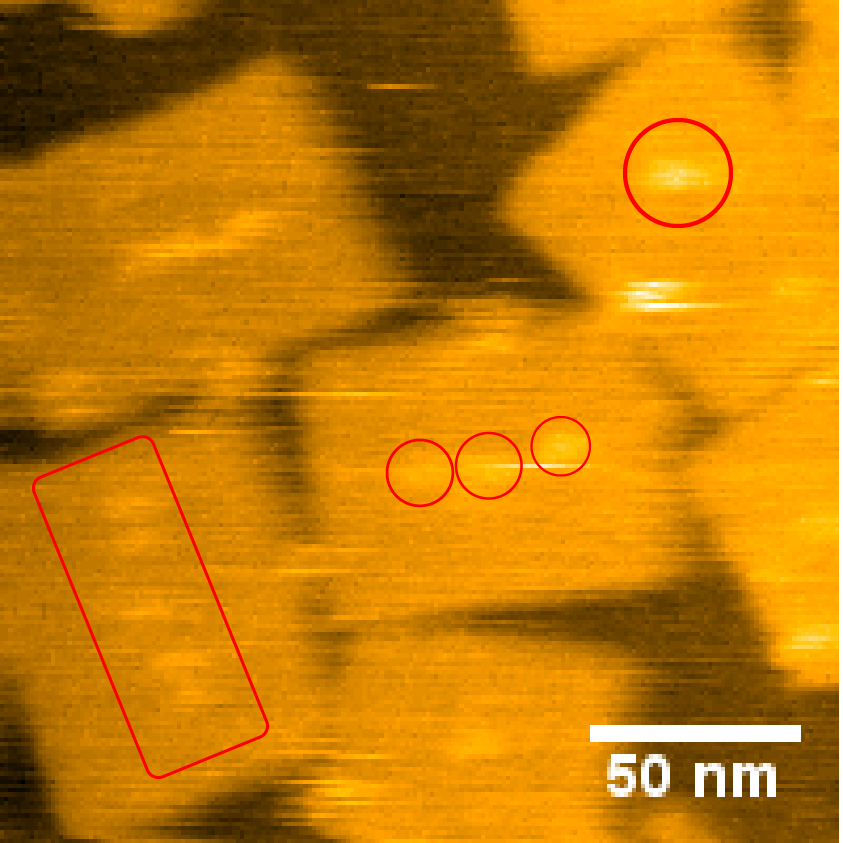
After taking pictures of around 140 samples of the second connection (3T spacers), around 25% of the monomers appeared to form dimers. The representative image is represented in fig 6.5a and the bar graph in fig 6.5b.
Unfortunately, due to technical difficulties, the AFM observation for 8T spacer was not taken well enough to be considered in the conclusion.
The result of gel electrophoresis did not differ between 3T and 8T spacers. Furthermore, the connection yielded a relatively low yield of connection by just looking at the gel electrophoresis results. However, the formed dimers showed clean dimerization between the monomers, therefore it will be brought on to the next experiments.
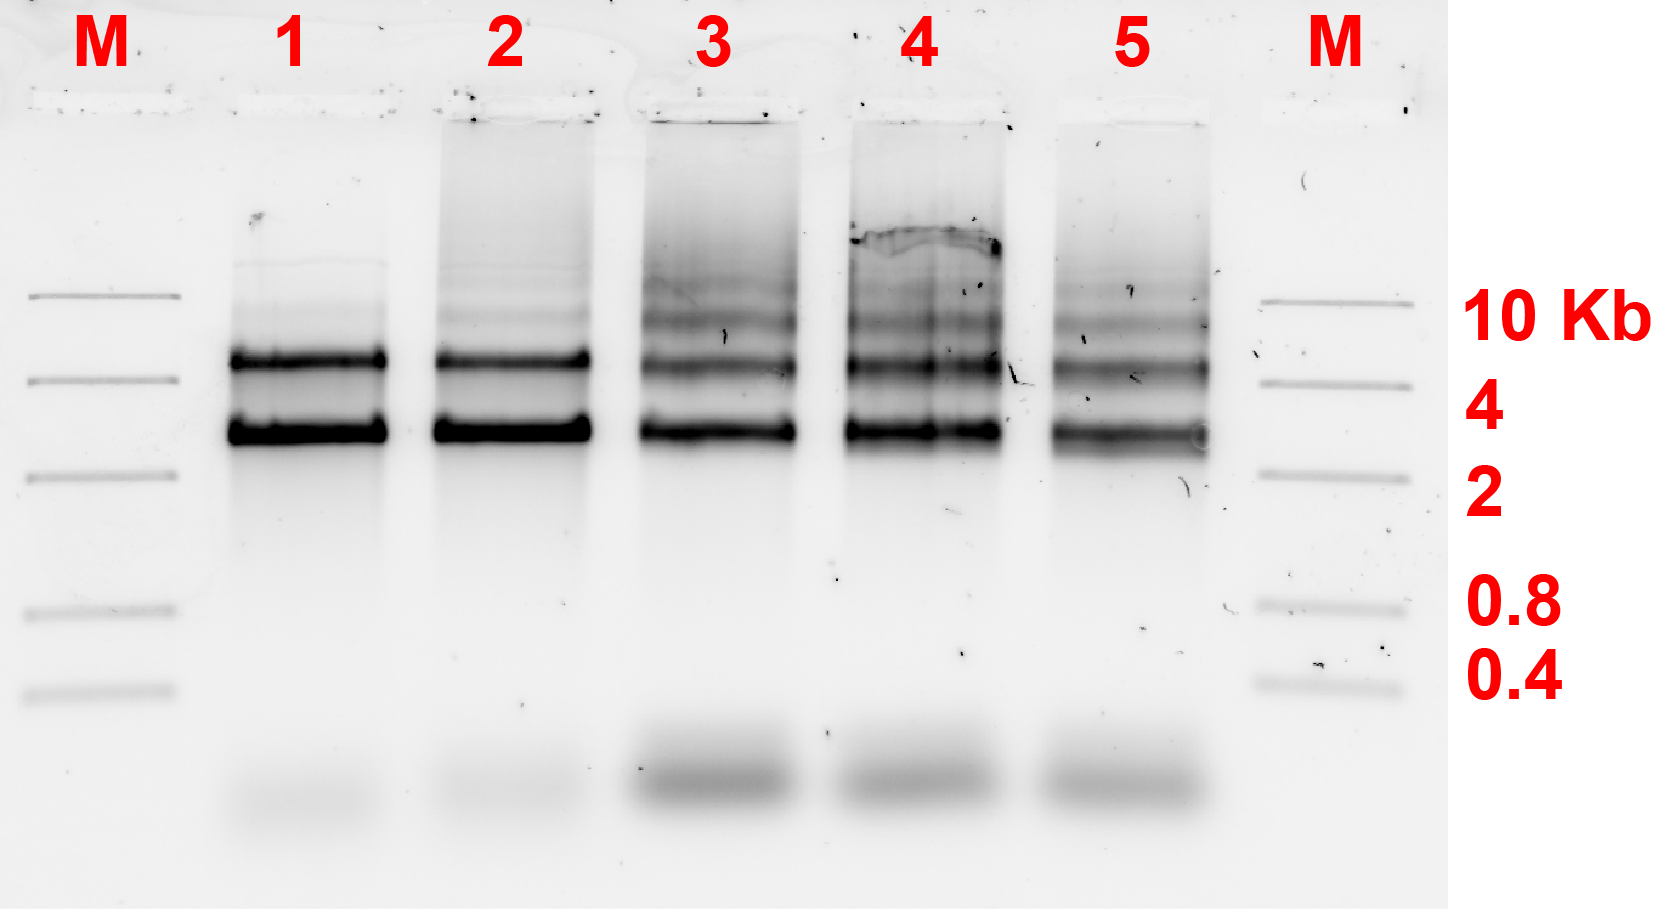
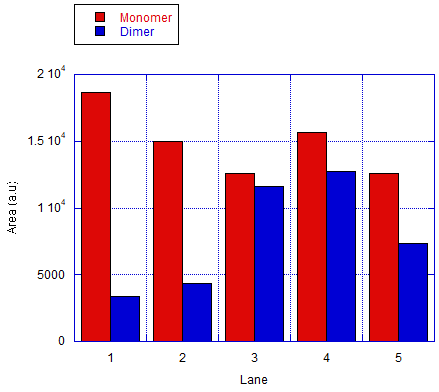
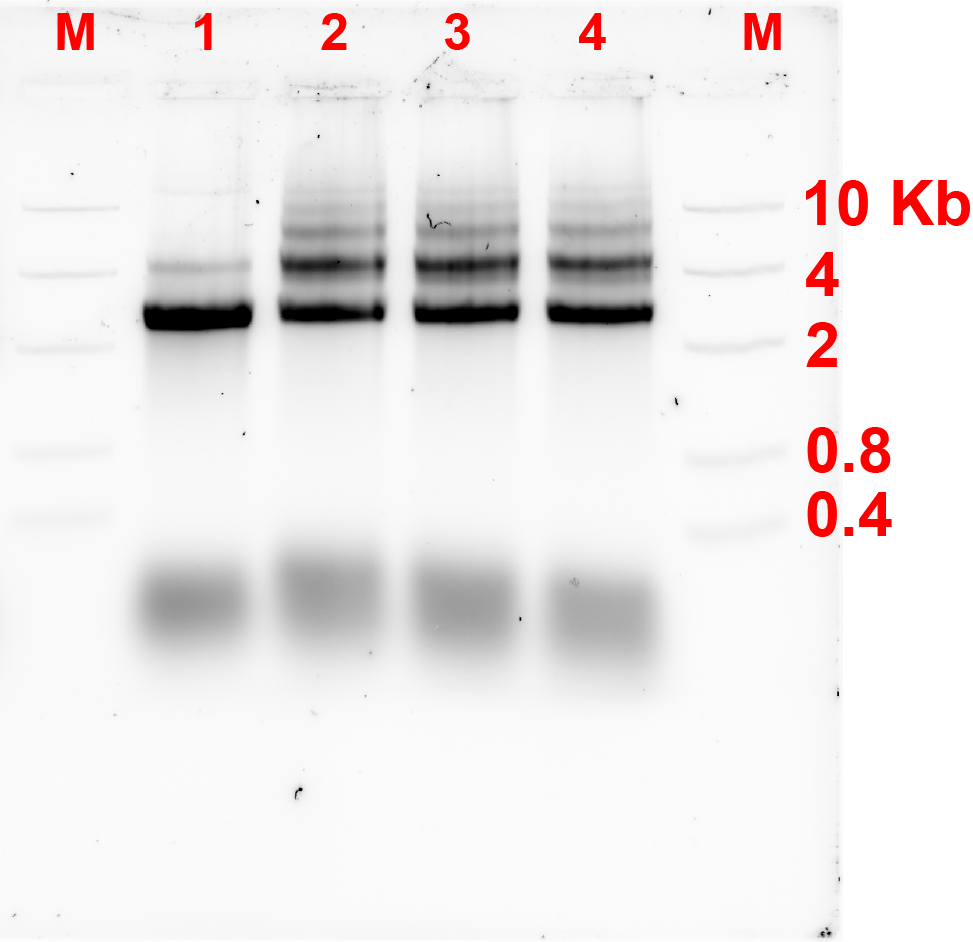
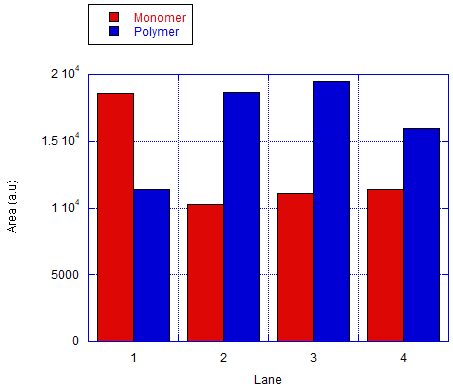
We also tested the other connection method by using bridge that connects the protruding strands. The monomers will be labeled as A and C. The ratio of the different monomers are 1:1 and the bridge will be 5-fold of the monomers. Fig 7.1b shows the results of the analysis done of the gel by measuring the area of the bands. The result shows an efficiency of around 37-48% in forming dimers and is significantly higher than the ones that are expected to only monomers.
The AFM result in fig 7.2a was selected as a representative of the succesful dimer. After taking observations of about 200 monomers through estimation, it was found that around half of the monomers have formed dimer which means that the efficiency of this connection was at around 46% as represented by a bar graph on fig 7.2b.
Even though the third connection design that involves bridge seemed to be more concrete, we decided to use the second connection design for the succeeding experiments due to time constraints and that the AFM results showed that the connections are relatively stable.

Connection design 2 (3T) was used to induce polymerization by having protruding strands on 3 of the sides of the triangle monomers. The results of polymerization are shown in fig 7.3a and b. From fig 7.3a, we can see that there are clearly heavier bands where monomers with protruding strands are present in the solution, which means that a degree of polymerization has occured. The AFM image taken is available on fig 7.4, the image did not clearly show polymerization, but a degree of clustering has occured.
The trigger mechanism was annealed based on the condition specified. As seen in fig 8.1, sheet with protruding strands showed a more pronounced larger band. This probably happened due to the strands affecting the flow of the sheets through the gel. By looking at lane 3 to 5, it was possible that the fasteners were not able to fasten the sheets and form a tube and thus means that more experiments might be needed to confirm the closing by fasteners.
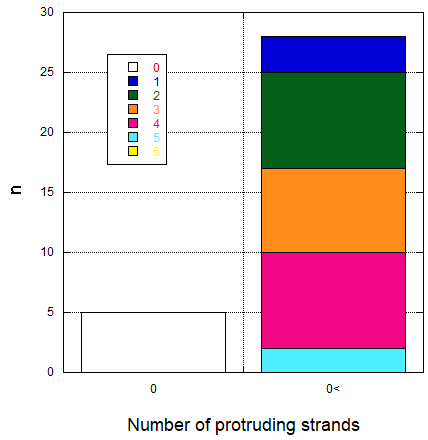
AFM observation as shown in fig 8.3a showed that the sheets have annealed properly to form rectangular sheets of proper size. Moreover, the protruding strands were also visible and rough ImageJ intensity analysis were done for 28 sample structures and that the result is shown in fig 8.3b. However, it can be seen that there were no structure possessing 6 strands as designed, this might have been caused as the protruding strands were not large enough and uniform enough to form a point that is detectable by AFM. The structures that were observed to have none protruding strands were possibly due to the orientation of the structures where the protruding strands face the other side.
The locking of adapter was performed to prevent polymerization occuring before the presence of target molecules such as proteins. The result is shown in fig 8.5, however we can see that the efficiency is relatively low and thus we might need to alter the annealing condition to prevent aggregation of the sheets due to the addition of fasteners. It is also possible that this hybridization
Unfortunately, unlocking of the adapter sheet was not performed due to time constraints. Therefore, we will report the results during the presentation.
For the trigger mechanism, we succeeded in closing the sheet to prevent the monomers from aggregating before activation. The trigger mechanism was also designed by using single stranded DNA as a key and anti-key, not using protein as its intended function. Therefore, more experiments might be needed to confirm the feasibility of triggering the structure through protein binding. Nevertheless, Li et al. has shown that this mechanism is feasible and possibly needs readjustment of the annealing conditions.

Firstly, we have succeeded in establishing the design of the monomer. The design of the monomer also has side staple strands that can be modified to make way for elongated staple strands that can be used to make connections to polymerize the structures. The results as seen in figure 1.3a and 1.3b shows that the monomer is rather stable in solution. Nevertheless, more experiments with different monomer shapes might be required for different tasks such as those needing higher surface area or more point of contact between monomers. This means that we have completed our first goal which is to establish a functional monomer.
Moreover, we have established the connection needed to form dimers to a certain efficiency. Efficiency of the connections might be raised by using protruding strands that have a higher G-C content and the length of the connections. Moreover, polymerization was also achieved using connection design 2 with 3T spacers in the protruding strands. The result of this section means that we have realized our next goal in establishing means of connection between the monomers.
We have also succeeded in closing the adapter part by addition of fastener, this trigger design can also be triggered by protein in which was not performed in our project. Nevertheless, we have proven that the adapter/trigger design can be used to initiate polymerization upon activation.
However, we have not established a system that is ready for practical use in which the system can work as a group to maintain the concentration of a target molecule at a certain target location. Nevertheless, this project aims to establish the basics needed in realizing a working swarm nanorobot system that has been proven to be feasible through the experiments performed.